Metering of utility consumption for residential customers, public institutions and municipalities
With today’s increased electricity and gas prices, it is not enough to keep a spreadsheet of bills, it is not enough to read them once a month, because this way it is not possible to keep track of consumption at an adequate level, it is not possible to see when there were consumption peaks and consumption minima during the day, there is not enough data to reduce energy consumption while operating comfortably.
The WaterScope IoT Retrofit system makes metering data available through accessories mounted on existing meters. These accessories are installed on electricity, gas and water meters and continuously monitor the current consumption, storing the data and uploading it to an online system for the owner/operator to view. At the same time, it is possible to install temperature measuring devices in the appropriate rooms to ensure optimal temperature and consumption. Temperature meters do not indicate the temperature, so they do not affect the occupants’ perception of the temperature, but they do provide accurate data for optimising energy use.
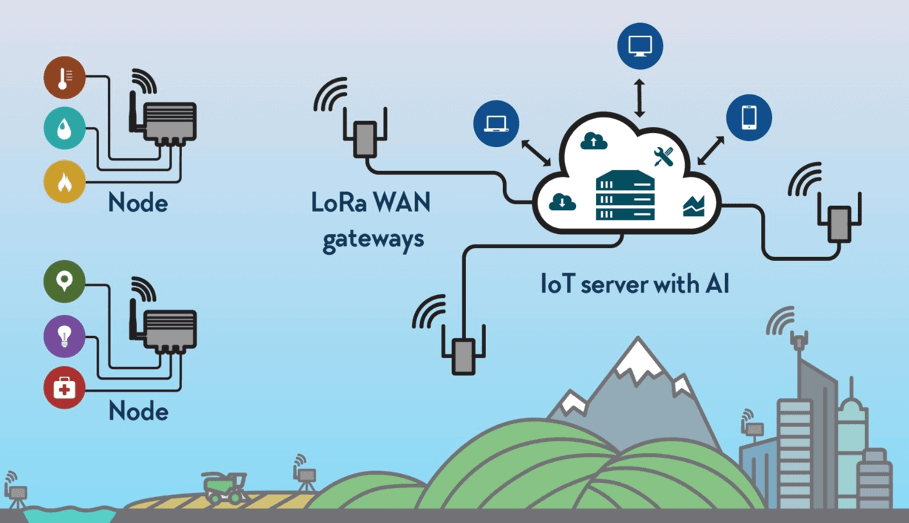
The WaterScope IoT Retrofit system transmits data wirelessly to the server using a new telecommunication technology that is not WIFI-based, providing a service available throughout the country, indoors and outdoors, with very high information security.
The simple and reliable display system allows easy monitoring of meter readings, daily, weekly and monthly consumption data, as well as the actual measured consumption values compared to the planned consumption. The data is available both on a computer screen and on a mobile device display, and can be easily viewed by anyone.
Continuous measurement and data reporting helps users to optimise the operation of their heating, lighting and other systems. Based on the consumption curves, optimal operation can be determined, efficiency can be improved, which means a reduction in consumption and thus a reduction in utility bills. By analysing the data, habits can be changed and institutions can achieve consumption reductions of up to 20%.
The reading of the meters is possible after the installation of a specific pulse conditioner, which can be determined and delivered after specifying the type of meter. Once the pulse measuring fitting has been connected to the data acquisition device, the device is automatically connected to the network and measurement and data transmission start. (Seek professional advice to determine the appropriate pulse generator condition, as it may not be possible to install a pulse generator condition for some meters.)
UPDATE
WaterScope IoT data collection system readings can be displayed on both a computer and a mobile device. If the display is done on a computer, the user is presented with a simple, web-based, browser-based display system, which, after entering a username and password, allows him to view, analyse and export his own meter data. Multiple users can have access to the measurement data of several different facilities, in which case they can select the dashboard at the top of the screen to view the facility data they currently want to view.
If you use a smart device, you can access your data through a free downloadable app, also after user identification. In this case, you can select the different facilities in the app.
The so-called dashboards, in each case, show the measured data in several different ways, so data can be displayed in time series on charts, current and aggregated data are displayed in numerical values, but also tabular and simplified colour charts and graphs help to quickly review the data, depending on what is important and useful for the user. Data can be easily exported in tabular form.
The system can handle preset alarms – if certain measured values exceed the preset alarm limit, the system sends an alarm to the preset device, an email alert to a computer, an alert to a tablet and a smart phone, or an SMS to a mobile phone.
In addition, the system can track consumption trends to indicate any deviation from the norm – e.g. in the case of a water meter, it will indicate a burst pipe, or both unwarranted electricity and gas consumption. It is also able to predict daily/weekly/monthly consumption based on continuous measurement, indicating the consumption of the predefined limit, and possible overrun.


